1st Grade Graphing and Charts (Data)
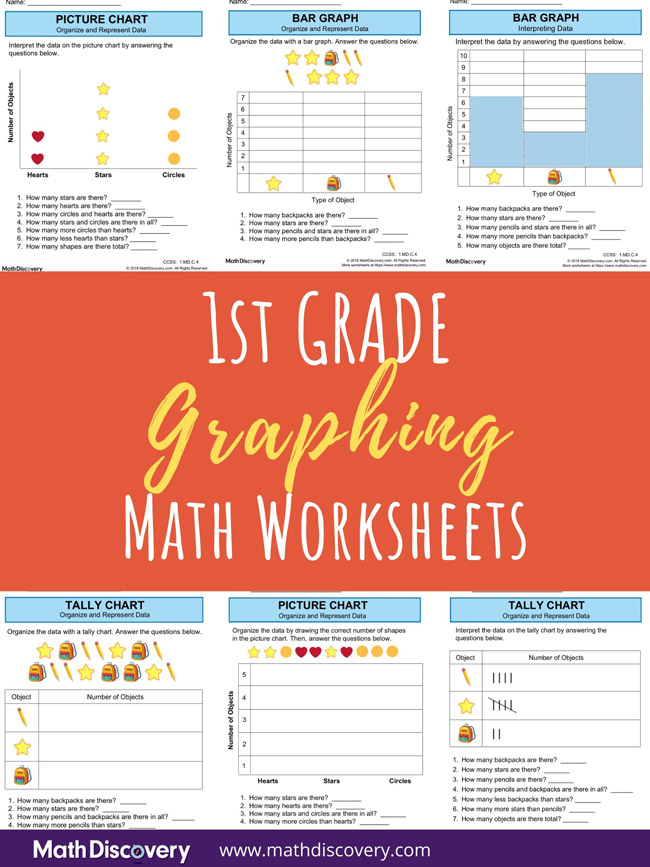
1st Grade Graphing Worksheets

1st Grade Graphing and Charts

Students organize data on picture chart, bar graphs, and in tally charts. They then use these representations to answer simple questions that involve counting, adding, or subtracting one-digit numbers. This set of worksheets is helpful to use to reinforce addition and subtraction skills.

Students make and use simple bar graphs and picture and tally charts. Some of the worksheets involve only representing data, while others involve answering questions about the data. Use the worksheets that involve making graphs and charts to reinforce interpreting skills. Students should be able to answer simple questions that involve counting, adding, or subtracting one-digit numbers. Reinforce making graphs and charts by having students collect data and organize it on a chart or graph. Some ways of generating data is having students keep track of things they see. For example, they could count the number of cars, trucks, and bikes they see on their way to or from school. They could count the number of trees, bushes, or other plants in their yard or in an area around the school.

(See complete 1st Grade Math Curriculum)

Worksheets (all activites are free, printable PDFs)

Picture Chart

Students represent data by cutting out pictures and putting them on a chart. Students then use the chart to answer questions.

Organize Data on a Picture Chart

Students organize data in the form of pictures by cutting them out and organizing them on a chart.

Interpret Data on a Picture Chart

Students are given a picture chart and are asked questions involving counting or one-digit addition or subtraction.

Bar Graph

Students represent data by shading parts of a bar. Students then use the bar graph to answer questions.

Organize Data on a Bar Graph

Students organize data by sorting and shading sections of a bar.

Interpret Data on a Bar Graph

Students are given a bar graph and are asked questions involving counting or one-digit addition or subtraction.


Tally Chart

Students represent data by making tallies on a chart. Students then use the tally chart to answer questions.

Organize Data on a Tally Chart

Students organize data by making tallies on a chart.

Interpret Data on a Tally Chart

Students are given a tally chart and are asked questions involving counting or one-digit addition or subtraction.