Kindergarten Sorting and Picture Graphs Worksheets
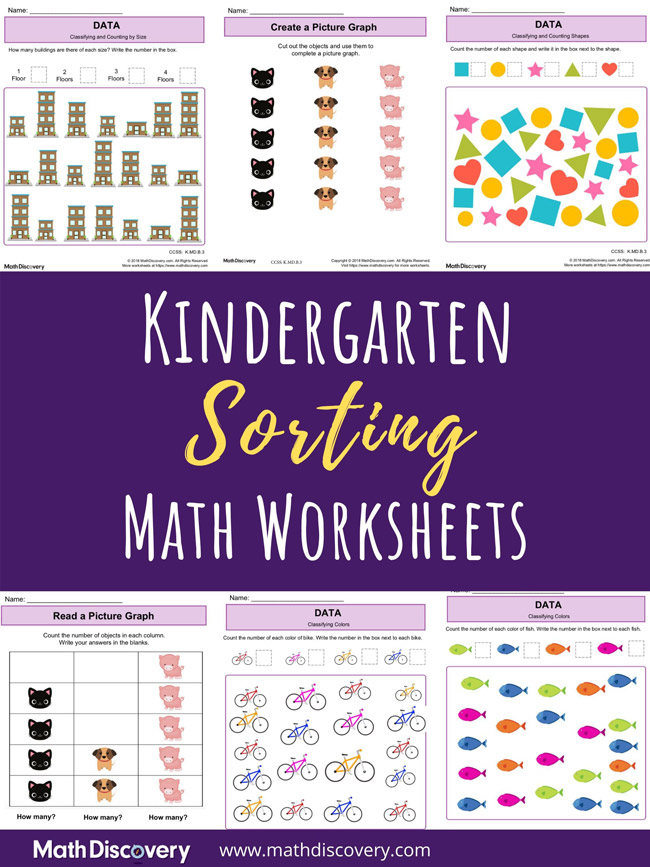
Kindergarten Sorting Worksheets

Introduction

Students generate data by sorting objects by color, shape, and size. You can reinforce this skill by having students sort buttons, socks, coins, blocks, or other small objects. Limit the number of categories to 3.

Some of the worksheets provide pictures for students to cut out and sort. The pictures are then glued or taped to a picture graph. You may want to make multiple copies of the blank picture graph and the pictures students sort. You can then combine sets of pictures to give students more practice sorting and graphing. Limit the number of categories to 3 and the number of objects in each category to 10.

(See all Kindergarten Math Worksheets)

Teach Your Kindergarten Student to Sort and Graph

Worksheets (all activites are free, printable PDFs)

Sorting

Students sort by color, shape, and size. Help students cut out the objects. Then they can sort the objects into the groups described by moving them into separate areas on a table.

This math lesson meets these kindergarten common core standards: K.MD.B.3

Sort by Color

Students sort objects into three categories by their color—black, white, or gray.(4 printable worksheets)

Sort by Shape

Students sort objects into three categories by their shape. The possible shapes include triangle, circle, square, rectangle, or hexagon. (4 printable worksheets)

Sort by Size

Students sort objects into three categories by their size—small, medium, or large. (4 printable worksheets)

Make and Read Picture Graphs

Students will make picture graphs by first sorting images and then arranging them on a picture graph. Students also read picture graphs to answer simple questions that only require counting.

This math lesson meets these kindergarten common core standards: K.MD.B.3

Make a Picture Graph

Help students cut out the pictures. Then students sort into the categories described and arrangement on the picture graph frame. (6 printable worksheets)

Read a Picture Graph

Students are given a picture graph and they answer simple questions such as the number of objects in a given category. (3 printable worksheets)